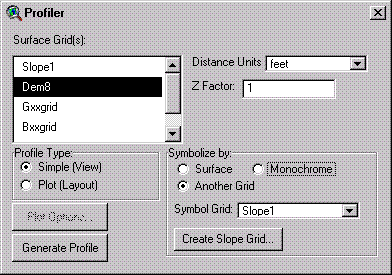
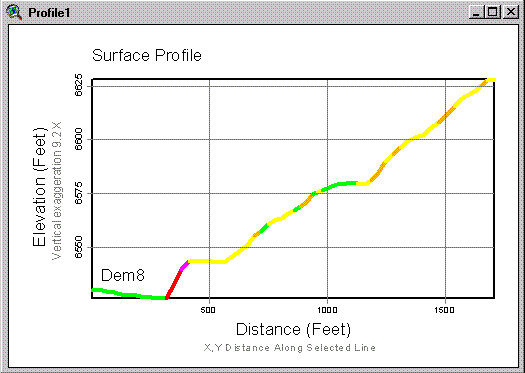
Profiler allows the user to generate surface profiles along a given route, where the route is a selected polyline in the active theme of a View. It will generate multiple profiles, symbolized according to the grid legends. It will also create one profile symbolized according to another grid (e.g. a slope grid). The extension adds a dialog:
To open the dialog, click on the View with the right mouse button and select "Profiler".
If the map units are defined for the View, a variety of distance units may be selected for the profile. The Z factor sets the number of XY units per Z unit (default 1).
There are three options for symbolizing profile lines:
The "Plot" profile type creates a layout document with a number of plot options. To bring up the "Plot Options" dialog, click the "Plot Options..." button:
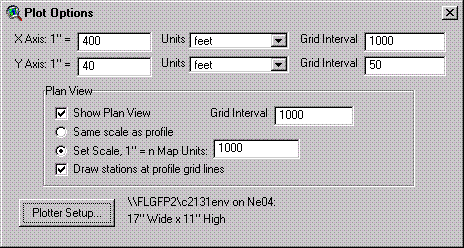
The dialog allows you to set the scale, units, and grid interval of the profile axes. A symbol legend will automatically be created above the profile. Optionally, a plan view of the route will also be created, and stations representing the profile distance grid lines can be plotted using the currently selected marker symbol.